Oxygen - Thermophysical properties
Chemical, Physical and Thermal Properties of Oxygen - O2.
Chemical, physical and thermal properties of Oxygen - O2 :
(Values at 25 oC (77 oF, 298 K) and atmospheric pressure)
| Molecular Weight | 31.9988 |
| Specific Gravity, air = 1 | 1.105 |
| Specific Volume (ft3/lb, m3/kg) | 12.24, 0.764 |
| Density of liquid at atmospheric pressure (lb/ft3, kg/m3) | 71.27, 1142 |
| Absolute Viscosity (lbm/ft s, centipoises) | 13.4×10⁻⁶, 0.020 |
| Sound velocity in gas (m/s) | 329 |
| Specific Heat - cp - (Btu/lb oF or cal/g oC, J/kgK) | 0.220, 920 |
| Specific Heat Ratio - cp/cv | 1.40 |
| Gas constant - R - (ft lb/lb oR, J/kg oC) | 48.3, 260 |
| Thermal Conductivity (Btu/hr ft oF, W/moC) | 0.015, 0.026 |
| Boiling Point - saturation pressure 14.7 psia and 760 mm Hg - (oF, oC) | -297.3, -182.97 |
| Latent Heat of Evaporation at boiling point (Btu/lb, J/kg) | 91.7, 213000 |
| Freezing or Melting Point at 1 atm (oF, oC) | -361.1, -218.4 |
| Latent Heat of Fusion (Btu/lb, J/kg) | 5.9, 13700 |
| Critical Temperature (oF, oC) | -181.5, -118.6 |
| Critical Pressure (psia, MN/m2) | 726, 5.01 |
| Critical Volume (ft3/lb, m3/kg) | 0.040, 0.0025 |
| Flammable | no |
Follow the links below to get values for the listed properties of oxygen at varying pressure and temperature :
See also more about atmospheric pressure, and STP - Standard Temperature and Pressure & NTP - Normal Temperature and Pressure,
as well as Thermophysical properties of: Acetone, Acetylene, Air, Ammonia, Argon, Benzene, Butane, Carbon dioxide, Carbon monoxide, Ethane, Ethanol, Ethylene, Helium, Hydrogen, Hydrogen sulfide, Methane, Methanol, Nitrogen, Pentane, Propane, Toluene, Water and Heavy water, D2O.
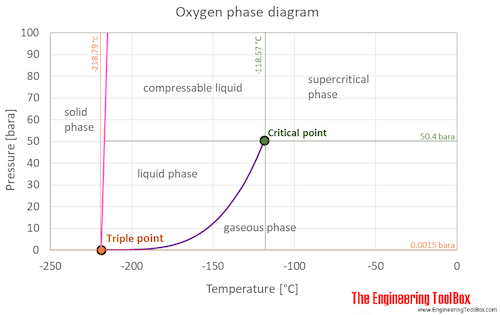
Oxygen is a gas at standard conditions. However, at low temperature and/or high pressures the gas becomes a liquid or a solid.
The oxygen phase diagram shows the phase behavior with changes in temperature and pressure. The curve between the critical point and the triple point shows the oxygen boiling point with changes in pressure. It also shows the saturation pressure with changes in temperature.

At the critical point there is no change of state when pressure is increased or if heat is added.
The triple point of a substance is the temperature and pressure at which the three phases (gas, liquid, and solid) of that substance coexist in thermodynamic equilibrium.


