Fuel Oils - Densities vs. Temperature
Variations in fuel oils density as function of temperatur, together with volume correction factors.
Correlations for fuel oils density and temperature are calculated by use of tools based on ASTM D 1250-04 and IP 200/04 (API Manual of Petroleum Measurement Standards, Chapter 11- physical properties Data, Section 1:Temperature and pressure volume correction factors for generalized crude oils, refined products and lubricating oils).
Examples of the use of the figures are given below the figures.
If you have the fuel oil density given in °API, use the API-to-gravity converter .
See also similar correlations for lubricating oil, crude oil and jet fuel.
Fuel Densities - Volume Correction vs. Temperature
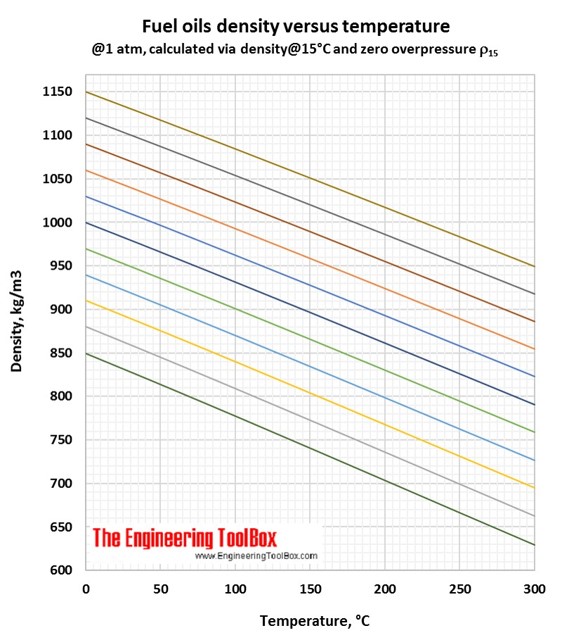
The diagrams below can be used to estimate fuel oil densities at other temperatures than specified.
Example - The density of a fuel oil is specified to be 900 kg/m3 at 15 oC - which corresponds to the yellow line in the diagram. The density of the same oil heated to 100 oC is by following the yellow line approximately 840 kg/m3.
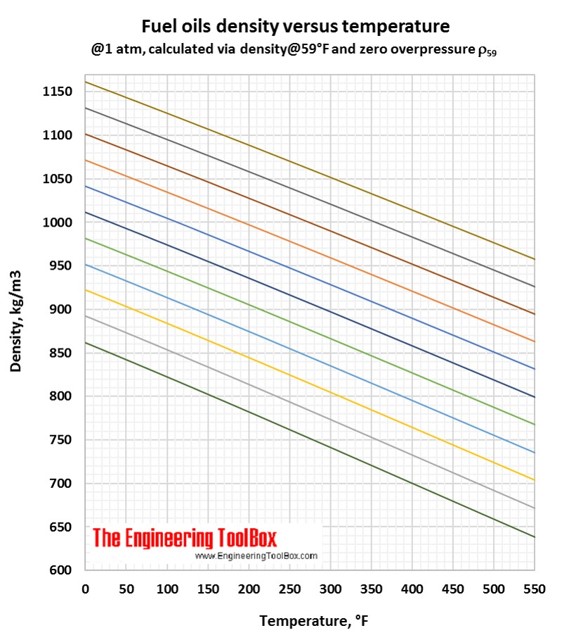

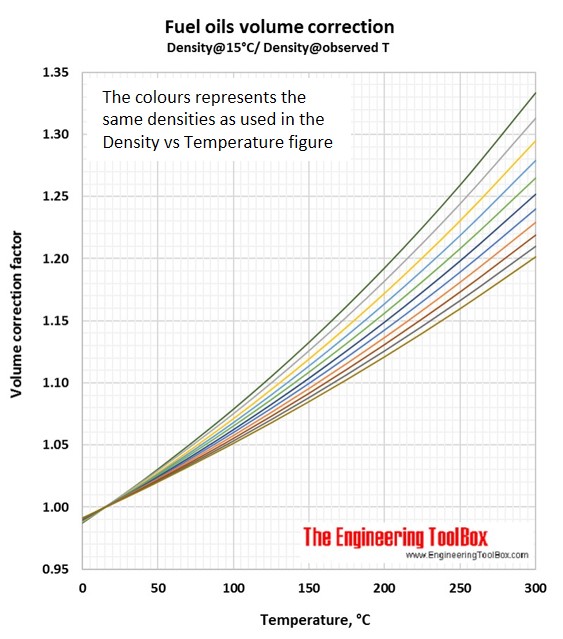
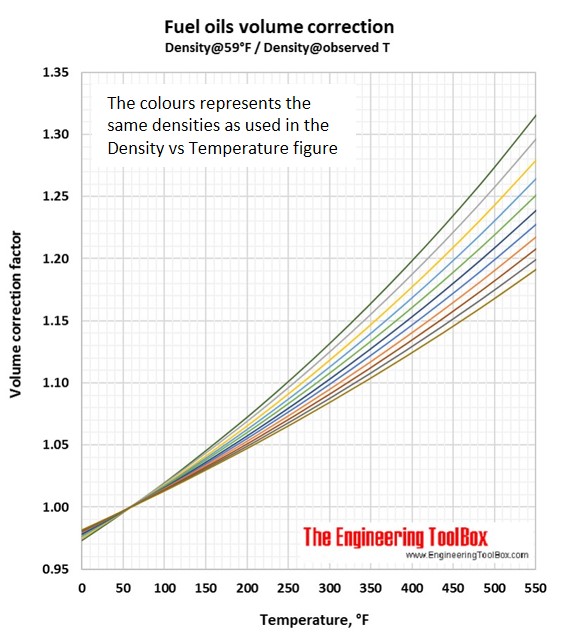
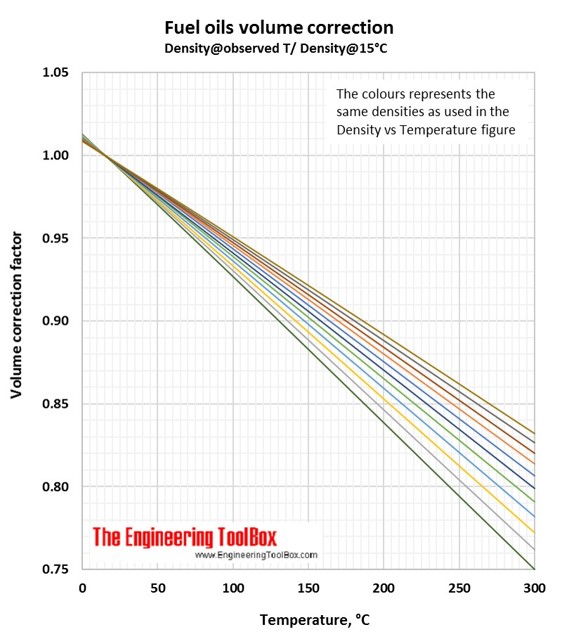
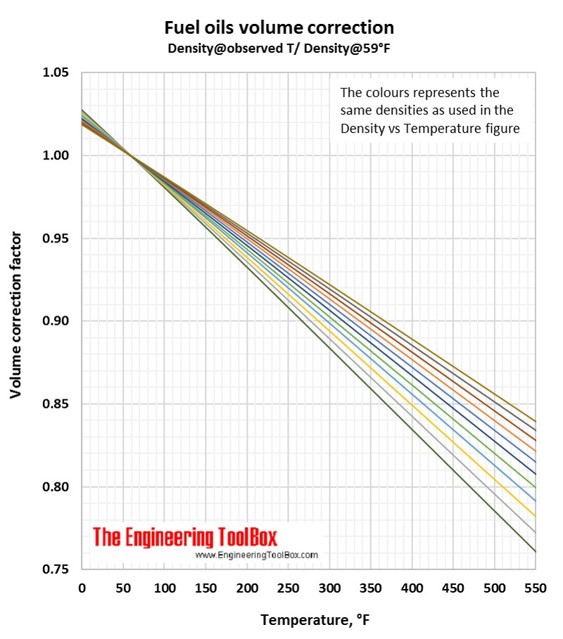
Volume correction factors can be used to calculate the volume of a product at base temperature (15°C/59°F) if you know the density and volume at another temperature. Or, if you know the base volume and density, you can use the volume correction factor to calculate the volume at another temperature. To be sure you have used the correct figure for correction factors, the easy rule is that the volume increases with increasing temperature.
1.
You have 100 liters of a fuel oil with a density of 800 kg/m3 at 200°C. How is the volume at 15°C?
In the Density vs temperature figure(°C), you se that the light blue line represent this fuel oil.
Then, use the light blue line in the Fuel oils volume correction figure (Density@Observed T/Density@15°C). At 200°C the correction factor is 0.859.
The volume of your fuel oil at 15°C is 100liters*0.859 = 86 liters. (Easy check: Lowest volume at the lowest temperature)
2.
You have 1000 m3 of a fuel oil with a density of 960 kg/m3 at 15°C. How will the volume change if you heat it to 100°C?
In the Density vs temperature figure (°C), you see that the light green line represent this fuel oil.
Then use the light green line in the Fuel oils volume correction figure (Density@15°C/Density@observed T). At 100°C the correction factor is 1.065.
The volume of your fuel oil at 100°C is 1000m3 *1.065 = 1065 m3. (Easy check: Lowest volume at the lowest temperature)


