Yield Structure of Crude Oils with Increasing Density of Crude
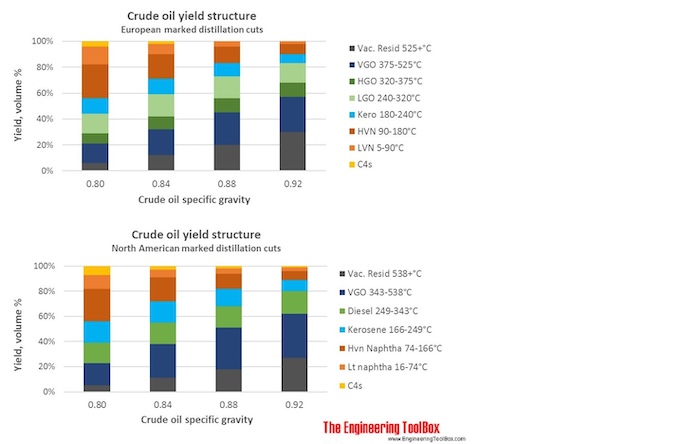
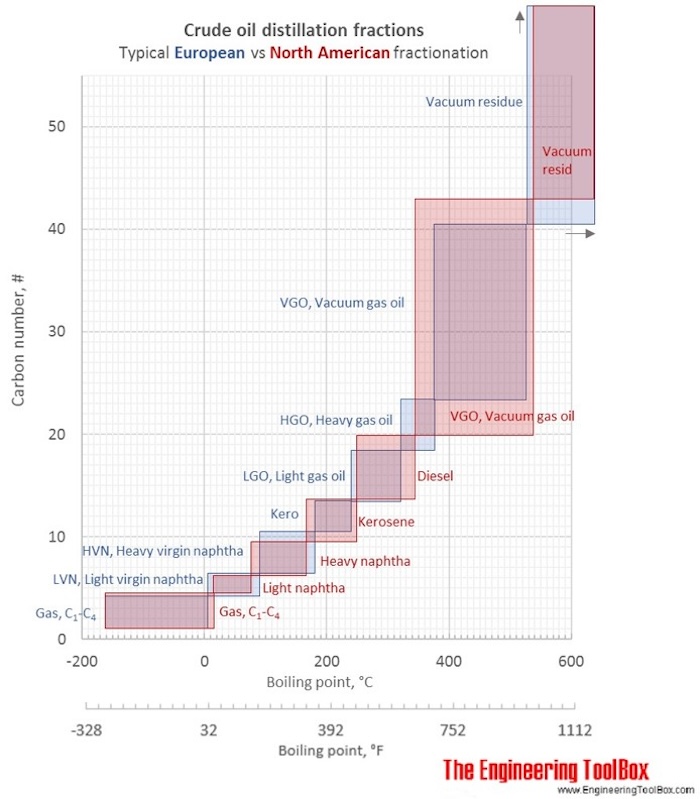
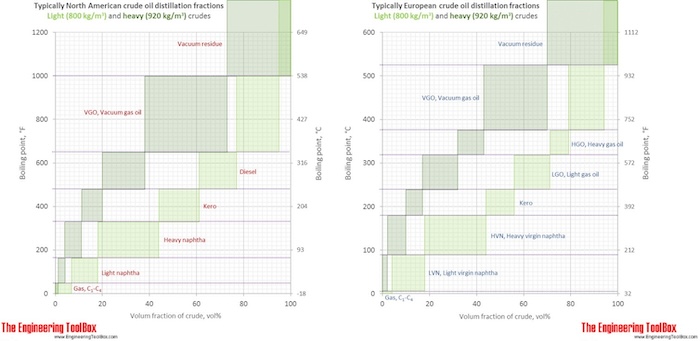
Yields of different crude oil distillation cuts are plotted as function of whole crude specific gravity. Fractions based on European and North American markets, and the typical differences in crude oil fractionation in the two markets are also shown.
The yield of different distillation cuts from crude oils vary with the specific gravity of the oil. Light crudes have a high content of light and heavy naphtha and relatively low content of vacuum gas oil and residue, compared to heavier crudes. The content of kerosine, light and heavy atmospheric gas oil (diesel) do not vary that much with whole crude gravity.
The first figure shows the yield of distillation cuts typical for European refineries, while the second figure shows yields of distillation cuts typical for North American refineries. The data used in the figures are from crudes from all over the world.
The differences in the refinery fractionation cut points are caused by differences in the fuel marked. North America has a larger gasoline marked than Europe, and gasoline is made from the naphtha fraction. Europe has more diesel cars, and a resulting larger need for gas oil (from which the diesel is made) from the crude oil. The differences in demanded volumes are met by varying the cut point emperatures between the different fractions, but also by selecting different cracking processes for the VGO and residue, favouring naphtha or gas oil production. The cut points given in the figures and tables below, are said to be typical , however, cut points varies from refinery to refinery, dependent on the refinery configuration and product portfolio. For each refinery, there will also be variations over the year, reflecting seasonal variations in the demanded volumes of gasoline, diesel and fuel oil, as well as differences in the quality specifications.
See also Crude oil viscosity as function of gravity, Crude oil metal content as function of gravity, Standard test methods for crude oil properties and Standard test methods and specifications for petroleum products .
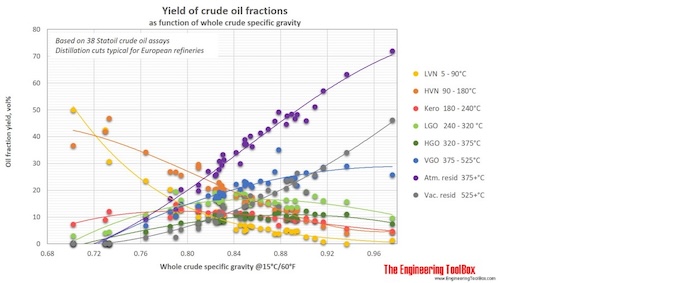
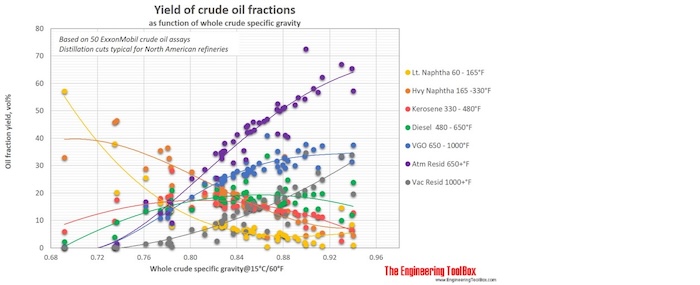
Tables below show typical volume% of the different distillation cuts for four crude oil specific gravities. The tabulated values are read from the trendlines in the figures above. As seen in the figures, some variation will occure, and this is due to differences in the crude oil origin, degradation history, geography and geology. The tabulated values are shown in column charts below the table.
| European marked | Distillation range | Whole crude specific gravity | ||||
|---|---|---|---|---|---|---|
| Crude fraction | °C | °F | 0.800 | 0.840 | 0.880 | 0.920 |
| C4s | - 5 | - 41 | 4 | 2 | 0 | 0 |
| Light naphtha | 5 - 90 | 41-194 | 14 | 8 | 4 | 2 |
| Heavy naphtha | 90 - 180 | 194 - 356 | 26 | 19 | 13 | 8 |
| Kero | 180 - 240 | 356 - 464 | 12 | 12 | 10 | 7 |
| Light gas oil | 240 - 320 | 464 - 608 | 15 | 17 | 17 | 15 |
| Heavy gas oil | 320 - 375 | 608 - 707 | 8 | 10 | 11 | 11 |
| Vacuum gas oil | 375 - 525 | 707 - 977 | 15 | 20 | 25 | 27 |
| Atmospheric resid | 375+ | 707+ | 21 | 32 | 45 | 57 |
| Vacuum resid | 525+ | 977+ | 6 | 12 | 20 | 30 |
| Yields of crude fractions given in volume% | ||||||
| North American marked | Distillation range | Whole crude specific gravity | ||||
| Crude fraction | °C | °F | 0.800 | 0.840 | 0.880 | 0.920 |
| C4s | - 16 | - 60 | 7 | 3 | 2 | 1 |
| Light naphtha | 16 - 74 | 60 - 165 | 11 | 6 | 4 | 3 |
| Heavy naphtha | 74 - 166 | 165 - 330 | 26 | 19 | 12 | 7 |
| Kerosene | 166 - 249 | 330 - 480 | 17 | 17 | 14 | 9 |
| Diesel | 249 - 343 | 480 - 650 | 16 | 17 | 17 | 18 |
| Vacuum gas oil | 343 - 538 | 650 - 1000 | 18 | 27 | 33 | 35 |
| Atmospheric resid | 343+ | 650+ | 23 | 38 | 51 | 62 |
| Vacuum resid | 538+ | 1000+ | 5 | 11 | 18 | 27 |
| Yields of crude fractions given in volume% | ||||||
The yield values in vol% are read from the trendlines in the figures at the top of the page, and are the same as in the table above.

