Liquid-Liquid Solution - Shrinkage and Estimation of Density
It is possible to estimate the density of a liquid-liquid solution from the density of the solute and the solvent. However, due to shrinkage, the estimate will be a bit too low.
Density (mass/volume unit) of solutions where both the solvent and the solute are liquids can be roughly estimated from density of the solute and the solvent by use of the formula:
Densitysolution = (x*ρ(solvent) + y*ρ(solute))/100 [1]
where
x = wt% of solvent
ρ(solvent) = density of solvent
y = wt% of solute
ρ(solute) = density of solute
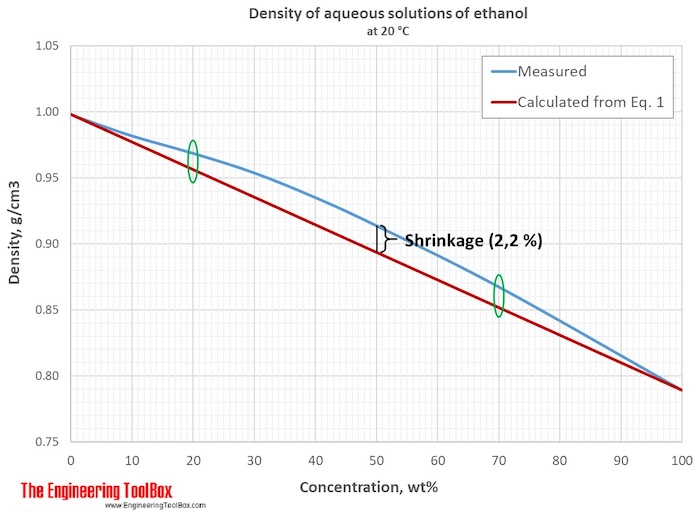
However, due to shrinkage, this will only be an estimate , with an error, varying with the concentration of the solute. The error is largest around 50 wt% concentration.
Concentration unit converter
Density of pure organic components: hydrocarbons , carboxylic acids and alcohols , sulphur compounds , nitrogen compounds and other common liquids.
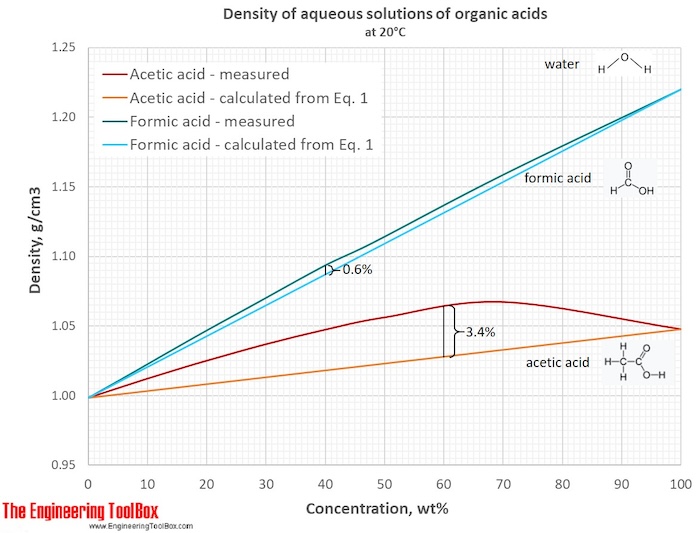
Shrinkage is that the resulting density is higher than calculated by Eq [1], and occurs when molecules with relativele large difference in size are mixed. Then, the smallest molecules are placed in voids between the larger molecules, and the density increases.
The shrinkage will increase with an increasing difference in the molecule size of the solvent and solute. However, also effects other than size, as molecular shape and polarity, will influence on the shrinkage.
Examples showing the effect of shrinkage
At 20°C, the density of water is 0.9982 g/cm3 and the density of pure ethanol is 0.7893 g/cm3 . For 20% ethanol, the density can be estimated using Eq [1]:
Density20% ethanol = (80[%]*0.9982 [g/cm3 ]+ 20[%]*0.7893[g/cm3 ])/100[%] = 0.9564 [g/cm3 ]
The same calculation is done for 50 and 70 wt% of ethanol, and the results and the difference from measured values are shown in the table below.
Mass% ethanol in water | Density measured | Density estimated | Difference in % |
0 | 0.9982 | ||
20 | 0.9687 | 0.9564 | 1.27 |
50 | 0.9139 | 0.8938 | 2.20 |
70 | 0.8676 | 0.8520 | 1.80 |
100 | 0.7893 |
In the figure below, it is seen that with ethanol concentrations < 20% and > 70%, the estimated values are closer to the measured values.
The figure below shows the shrinkage for aqueous solutions of formic and acetic acids. It illustrates that the shrinkage is largest when the difference in molecular size is largest.
Related Topics
-
Densities
Densities of solids, liquids and gases. Definitions and convertion calculators. -
Material Properties
Properties of gases, fluids and solids. Densities, specific heats, viscosities and more.
Related Documents
-
Alcohols and Carboxylic Acids - Physical Data
Molweight, melting and boiling point, density, pKa-values, as well as number of carbon and hydrogen atoms in molecules are given for 150 different alcohols and acids. -
Concentration Units Converter
Calculator and formulas for conversion between different units of concentration: Molarity, molality, mole fraction, weight percent of solute and grams of solute per liter of solution - descriptive terms for solubility. -
Crude Oil - Density vs. Temperature
Variations in crude oil density are shown as function of temperatur, together with volume correction factors. -
Crude Oil Properties - Standard test methods (ASTM and others)
An overview of common test methods and typical ranges of variation of petroleum quality parameters. What, why and how do the different test? -
Densities of Aqueous Solutions of Inorganic Chlorides
Changes in density of aqueous solutions with changes in concentration at 20°C. Density of inorganic chlorides in water is plotted as function of wt%, mol/kg water and mol/l solution. -
Densities of Aqueous Solutions of Inorganic Potassium Salts
Changes in density of aqueous solutions with changes in concentration at 20°C. Density of potassium salts in water is plotted as function of wt%, mol/kg water and mol/l solution. -
Densities of Aqueous Solutions of Inorganic Sodium Salts
Changes in density of aqueous solutions with changes in concentration at 20°C. Density of inorganic sodium salts in water is plotted as function of wt%, mol/kg water and mol/l solution. -
Densities of Aqueous Solutions of Organic Acids
Changes in density of aqueous solutions with changes in concentration at 20°C. Density of acetic acid, citric acid, formic acid, D-lactic acid, oxalic acid and trichloroacetic acid in water is plotted as function of wt%, mol/kg water and mol/l solution. -
Density of Aqueous Solutions of Organic Substances as Sugars and Alcohols
Changes in density of aqueous solutions with changes in concentration at 20°C. Density of some sugars, alcohols and other organic substances in water is plotted as function of wt%, mol/kg water and mol/l solution. -
Density of Aqueous Solutions of some Inorganic Substances
Changes in density of aqueous solutions with changes in concentration at 20°C. Density of inorganic substances in water is plotted as function of wt%, mol/kg water and mol/l solution. -
Ethanol Water Mixtures - Densities vs. Temperature
Density of Ethyl Alcohol aqueous solutions. -
Fuel Oils - Densities vs. Temperature
Variations in fuel oils density as function of temperatur, together with volume correction factors. -
Hydrocarbons - Physical Data
Molweight, melting and boiling point, density, flash point and autoignition temperature, as well as number of carbon and hydrogen atoms in each molecule for 200 different hydrocarbons. -
Hydrocarbons, Linear Alcohols and Acids - Densities
Density of hydrocarbons like alcohols and acids as function of carbon number at 20°C / 68°. -
Inorganic Compounds in Water - Melting and Boiling Temperature, Density and Solubility
Physical constants for more than 280 common inorganic compounds. Density is given for the actual state at 25°C and for liquid phase at melting point temperature. -
Jet Fuel - Density vs. Temperature
Variations in jet fuel density as function of temperatur, together with volume correction factors. -
Lubricating Oil - Densities vs. Temperature
Variations in lubricating oil density as function of temperatur, together with volume correction factors. -
Mixtures, Solutions and Suspensions
Mixtures vs. solutions vs. suspensions. -
Organic Nitrogen Compounds - Physical Data
Boiling and melting points of amines, diamines, pyrroles, pyridines, piperidines and quinolines shown together with their molecular structures, as well as molweights and density. -
Organic Sulfur Compounds - Densities
Liquid density of different kinds of organic sulfur compounds with varying carbon number (20°C/68°F). Comparison of thiols, sulfides, disulfides and thiophenes. -
Organic Sulfur Compounds - Physical Data
Boiling and melting points of thoils, sulfides, disulfides and thiophenes shown together with molecular structures, as well as molweights and density. -
Petroleum Products - Standard Test Methods (ASTM and others) and Specifications
An overview of common test methods and specifications of petroleum fuels. What, why and how do the different test?