Air - Properties at Gas-Liquid Equilibrium Conditions
Properties of air change along the boiling and condensation curves (temperature and pressure between triple point and critical point conditions). An air phase diagram included.
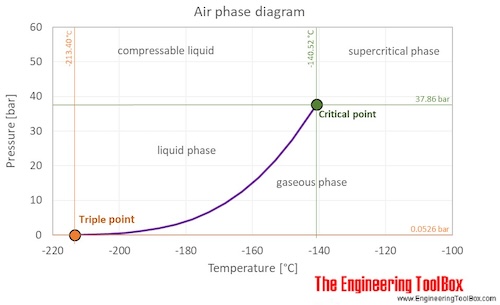
At standard conditions, air is a mixture of gases. However, at low temperature and high pressures the gas mixture becomes a liquid. The air phase diagram shows the phase behavior with changes in temperature and pressure. The curve between the triple point and the critical point shows the air boiling point with changes in pressure.
Critical point: The end point of the pressure-temperature curve that designates conditions under which a liquid and its vapor can coexist. At higher temperatures, the gas cannot be liquefied by pressure alone. At the critical point, defined by the critical temperature T c and the critical pressure P c , phase boundaries vanish.
Critical temperature of air: 132.63 K = -140.52 °C = -220.94 °F
Critical pressure of air: 37.363 atm = 37.858 bar = 3.7858 MPa (MN/m2) = 549.08 psi (=lbf /in2)
Triple point: The temperature and pressure at which the three phases (gas, liquid, and solid) of a substance coexist in thermodynamic equilibrium
Triple point pressure of air: 0.05196 atm = 0.05265 bar = 5265 Pa = 0.7636 psi (=lbf /in2)
Triple point temperature of air: 59.75 K = -213.40 °C = -352.12 °F
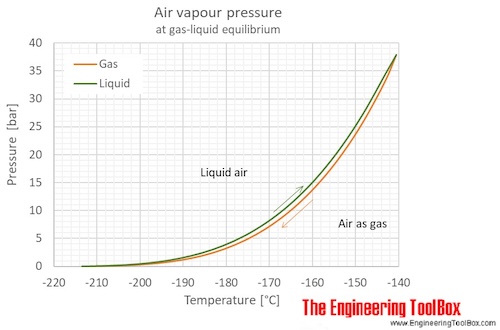
The figures below show the changes in thermophysical properties along the air boiling and condensation curves: Vapour pressure , density , viscosity , heat capacity , thermal conductivity .
Tabulated values given in SI and imperial units, and unit converters are given below the figures.
See also properties of Air at varying temperature and pressure: Density and specific weight at varying temperature , Density at varying pressure , Diffusion Coefficients for Gases in Air , Prandtl Number , Specific heat at varying temperature and Specific heat at varying pressure , Thermal Conductivity , Thermal Diffusivity , and Air thermophysical properties at standard conditions and Composition and molecular weight ,
The following figures show how the properties of air changes along the boiling and condensation curves (shown in the figure above) - SI units:
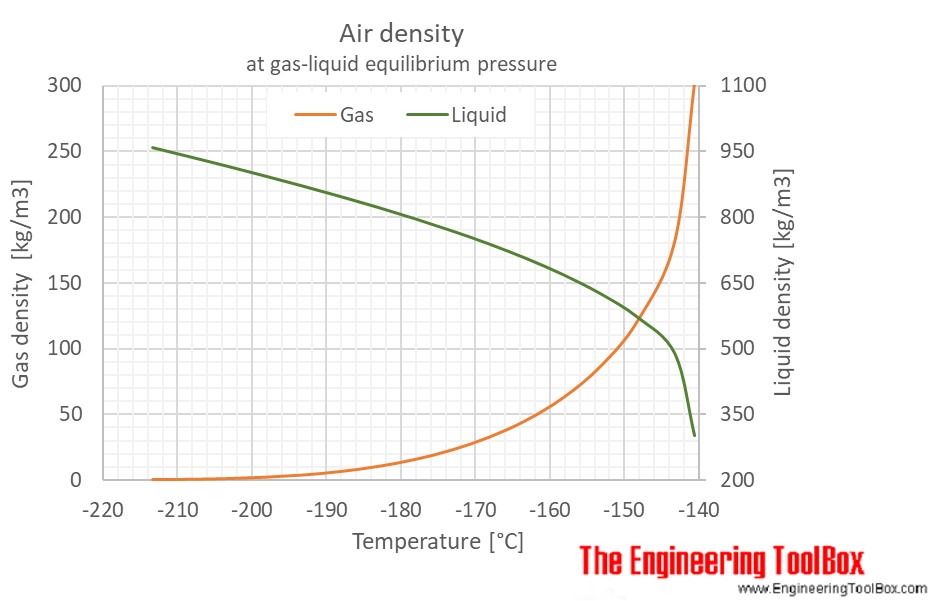
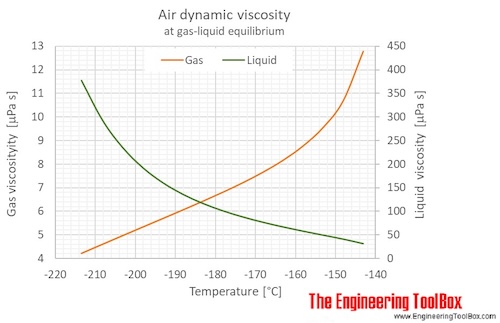
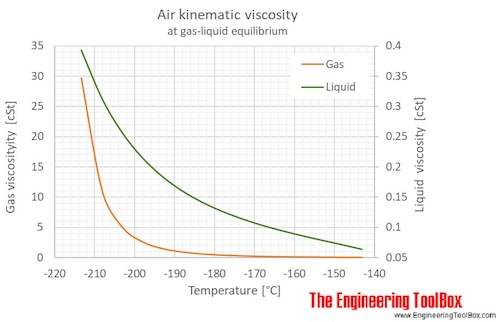
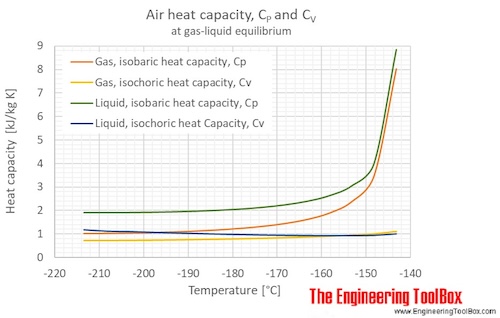
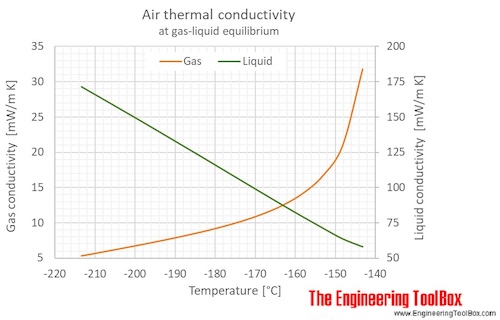
Properties of air along the boiling and condensation curves - SI units:
For full table with thermal conductivity, dynamic and kinematic viscosity - rotate the screen!
| Temperature | Pressure | Density | Heat capacity CV | Heat capacity CP | Thermal conductivity | Dynamic Viscosity | Kinematic viscosity | ||
|---|---|---|---|---|---|---|---|---|---|
| [K] | [°C] | [bara] | [g/l], [kg/m3 ] | [kJ/kg K] | [kJ/kg K] | [mW/m K] | [kcal(IT)/(h m K)] | [μPa s] | [cSt], [m2/s*10-6 ] |
| Liquid | |||||||||
| 59.75 | -213.40 | 0.05265 | 957.6 | 1.174 | 1.901 | 171.4 | 0.1474 | 376.6 | 0.3933 |
| 65 | -208.2 | 0.1432 | 935.9 | 1.118 | 1.902 | 162.9 | 0.1401 | 292.4 | 0.3124 |
| 70 | -203.2 | 0.31908 | 914.6 | 1.102 | 1.908 | 154.7 | 0.1330 | 234.8 | 0.2567 |
| 75 | -198.2 | 0.63326 | 892.7 | 1.072 | 1.919 | 146.5 | 0.1260 | 192.4 | 0.2155 |
| 80 | -193.2 | 1.1462 | 870.2 | 1.045 | 1.938 | 138.2 | 0.1188 | 160.4 | 0.1843 |
| 85 | -188.2 | 1.9262 | 846.7 | 1.020 | 1.964 | 129.8 | 0.1116 | 135.8 | 0.1604 |
| 90 | -183.2 | 3.0475 | 822.2 | 0.9981 | 2.003 | 121.4 | 0.1044 | 116.4 | 0.1415 |
| 95 | -178.2 | 4.5886 | 796.2 | 0.9786 | 2.056 | 112.9 | 0.09709 | 100.7 | 0.1264 |
| 100 | -173.2 | 6.6313 | 768.5 | 0.9617 | 2.130 | 104.4 | 0.08978 | 87.61 | 0.1140 |
| 105 | -168.2 | 9.2606 | 738.6 | 0.9477 | 2.236 | 95.93 | 0.08249 | 76.41 | 0.1035 |
| 110 | -163.2 | 12.564 | 705.6 | 0.9373 | 2.389 | 87.55 | 0.07528 | 66.54 | 0.0943 |
| 115 | -158.2 | 16.633 | 668.5 | 0.9314 | 2.628 | 79.34 | 0.06822 | 57.57 | 0.0861 |
| 120 | -153.2 | 21.557 | 625.3 | 0.9325 | 3.048 | 71.36 | 0.06136 | 49.13 | 0.0786 |
| 125 | -148.2 | 27.427 | 571.4 | 0.9473 | 4.001 | 63.66 | 0.05474 | 40.76 | 0.0713 |
| 130 | -143.2 | 34.295 | 488.4 | 1.010 | 8.846 | 58.05 | 0.04992 | 31.07 | 0.0636 |
| 132.63 | -140.52 | 37.858 | 302.6 | 17.83 | 0.0589 | ||||
| Gas | |||||||||
| 59.75 | -213.40 | 0.02432 | 0.1421 | 0.7183 | 1.009 | 5.294 | 0.004552 | 4.220 | 29.69 |
| 65 | -208.2 | 0.07756 | 0.4182 | 0.7219 | 1.017 | 5.844 | 0.005025 | 4.606 | 11.01 |
| 70 | -203.2 | 0.19431 | 0.9787 | 0.7275 | 1.030 | 6.376 | 0.005482 | 4.970 | 5.078 |
| 75 | -198.2 | 0.42282 | 2.006 | 0.7354 | 1.050 | 6.920 | 0.005950 | 5.333 | 2.658 |
| 80 | -193.2 | 0.82321 | 3.711 | 0.7459 | 1.078 | 7.485 | 0.006436 | 5.694 | 1.534 |
| 85 | -188.2 | 1.4665 | 6.336 | 0.7589 | 1.116 | 8.082 | 0.006949 | 6.057 | 0.9560 |
| 90 | -183.2 | 2.4320 | 10.16 | 0.7746 | 1.166 | 8.725 | 0.007502 | 6.427 | 0.6327 |
| 95 | -178.2 | 3.8047 | 15.50 | 0.7928 | 1.232 | 9.439 | 0.008116 | 6.810 | 0.4393 |
| 100 | -173.2 | 5.6742 | 22.77 | 0.8137 | 1.320 | 10.26 | 0.008819 | 7.215 | 0.3169 |
| 105 | -168.2 | 8.1341 | 32.49 | 0.8375 | 1.440 | 11.24 | 0.009662 | 7.659 | 0.2357 |
| 110 | -163.2 | 11.282 | 45.42 | 0.8651 | 1.614 | 12.47 | 0.01072 | 8.163 | 0.1797 |
| 115 | -158.2 | 15.223 | 62.75 | 0.8981 | 1.887 | 14.15 | 0.01216 | 8.770 | 0.1398 |
| 120 | -153.2 | 20.067 | 86.57 | 0.9399 | 2.373 | 16.64 | 0.01430 | 9.552 | 0.1103 |
| 125 | -148.2 | 25.949 | 121.5 | 0.9981 | 3.474 | 20.97 | 0.01803 | 10.68 | 0.0879 |
| 130 | -143.2 | 33.084 | 182.7 | 1.095 | 8.031 | 31.81 | 0.02735 | 12.78 | 0.0699 |
| 132.63 | -140.52 | 37.858 | 302.6 | 17.83 | 0.0589 | ||||
Properties of air along the boiling and condensation curves - Imperial units:
For full table with thermal conductivity, dynamic and kinematic viscosity - rotate the screen!
| Temperature | Pressure | Density | Heat capacity CV | Heat capacity CP | Thermal conductivity | Dynamic viscosity | Kinematic viscosity | |||
|---|---|---|---|---|---|---|---|---|---|---|
| [K] | [°F] | [psia] | [lb/ft3 ] | [sl/ft3 ] | [Btu(IT)/lb °F] | [Btu(IT)/lb °F] | [Btu(IT)/(h ft °F)] | [lbf s/ft2 *10-6] | [lbm /ft s*10-6 ] | [ft2/s*10-6 ] |
| Liquid | ||||||||||
| 59.75 | -352.12 | 0.76363 | 59.79 | 1.858 | 0.2805 | 0.4541 | 0.09905 | 7.866 | 253.1 | 4.233 |
| 65 | -343.7 | 2.077 | 58.43 | 1.816 | 0.2671 | 0.4543 | 0.09413 | 6.107 | 196.5 | 3.363 |
| 70 | -334.7 | 4.6279 | 57.10 | 1.775 | 0.2632 | 0.4557 | 0.08940 | 4.904 | 157.8 | 2.763 |
| 75 | -325.7 | 9.1847 | 55.73 | 1.732 | 0.2560 | 0.4584 | 0.08464 | 4.017 | 129.3 | 2.319 |
| 80 | -316.7 | 16.624 | 54.32 | 1.688 | 0.2495 | 0.4628 | 0.07982 | 3.350 | 107.8 | 1.984 |
| 85 | -307.7 | 27.937 | 52.86 | 1.643 | 0.2437 | 0.4692 | 0.07499 | 2.836 | 91.24 | 1.726 |
| 90 | -298.7 | 44.200 | 51.33 | 1.595 | 0.2384 | 0.4783 | 0.07013 | 2.431 | 78.20 | 1.524 |
| 95 | -289.7 | 66.552 | 49.71 | 1.545 | 0.2337 | 0.4911 | 0.06524 | 2.103 | 67.65 | 1.361 |
| 100 | -280.7 | 96.179 | 47.98 | 1.491 | 0.2297 | 0.5088 | 0.06033 | 1.830 | 58.87 | 1.227 |
| 105 | -271.7 | 134.31 | 46.11 | 1.433 | 0.2264 | 0.5339 | 0.05543 | 1.596 | 51.35 | 1.114 |
| 110 | -262.7 | 182.23 | 44.05 | 1.369 | 0.2239 | 0.5707 | 0.05059 | 1.390 | 44.71 | 1.015 |
| 115 | -253.7 | 241.24 | 41.73 | 1.297 | 0.2225 | 0.6278 | 0.04584 | 1.202 | 38.69 | 0.927 |
| 120 | -244.7 | 312.66 | 39.04 | 1.213 | 0.2227 | 0.7279 | 0.04123 | 1.026 | 33.01 | 0.846 |
| 125 | -235.7 | 397.80 | 35.67 | 1.109 | 0.2263 | 0.9556 | 0.03678 | 0.8512 | 27.39 | 0.768 |
| 130 | -226.7 | 497.41 | 30.49 | 0.9477 | 0.2411 | 2.113 | 0.03354 | 0.6490 | 20.88 | 0.685 |
| 132.63 | -220.94 | 549.08 | 18.89 | 0.5872 | 0.3724 | 11.98 | 0.634 | |||
| Gas | ||||||||||
| 59.75 | -352.12 | 0.3527 | 0.00887 | 0.000276 | 0.1716 | 0.2409 | 0.003059 | 0.0881 | 2.836 | 319.562 |
| 65 | -342.7 | 1.1249 | 0.02611 | 0.000811 | 0.1724 | 0.2429 | 0.003377 | 0.0962 | 3.095 | 118.544 |
| 70 | -333.7 | 2.8182 | 0.06110 | 0.001899 | 0.1738 | 0.2460 | 0.003684 | 0.1038 | 3.340 | 54.663 |
| 75 | -324.7 | 6.1325 | 0.1253 | 0.003893 | 0.1757 | 0.2508 | 0.003998 | 0.1114 | 3.583 | 28.608 |
| 80 | -315.7 | 11.940 | 0.2317 | 0.00720 | 0.1782 | 0.2574 | 0.004325 | 0.1189 | 3.826 | 16.514 |
| 85 | -306.7 | 21.270 | 0.3956 | 0.01229 | 0.1813 | 0.2665 | 0.004670 | 0.1265 | 4.070 | 10.290 |
| 90 | -297.7 | 35.273 | 0.6341 | 0.01971 | 0.1850 | 0.2785 | 0.005041 | 0.1342 | 4.319 | 6.811 |
| 95 | -288.7 | 55.183 | 0.9677 | 0.03008 | 0.1894 | 0.2942 | 0.005454 | 0.1422 | 4.576 | 4.729 |
| 100 | -279.7 | 82.297 | 1.421 | 0.04418 | 0.1943 | 0.3152 | 0.005926 | 0.0119 | 0.381 | 3.411 |
| 105 | -270.7 | 117.98 | 2.028 | 0.06304 | 0.2000 | 0.3440 | 0.006493 | 0.1600 | 5.146 | 2.537 |
| 110 | -261.7 | 163.63 | 2.836 | 0.08814 | 0.2066 | 0.3855 | 0.007207 | 0.1705 | 5.486 | 1.934 |
| 115 | -252.7 | 220.79 | 3.917 | 0.1218 | 0.2145 | 0.4506 | 0.008173 | 0.1832 | 5.893 | 1.504 |
| 120 | -243.7 | 291.05 | 5.405 | 0.1680 | 0.2245 | 0.5668 | 0.009612 | 0.1995 | 6.419 | 1.188 |
| 125 | -234.7 | 376.36 | 7.583 | 0.2357 | 0.2384 | 0.8298 | 0.01212 | 0.2231 | 7.177 | 0.947 |
| 130 | -225.7 | 479.84 | 11.41 | 0.3545 | 0.2616 | 1.918 | 0.01838 | 0.2668 | 8.584 | 0.753 |
| 132.63 | -220.94 | 549.08 | 18.89 | 0.5872 | 0.3724 | 11.98 | 0.634 | |||
Density unit converter
Dynamic viscosity unit converter
Kinematic viscosity unit converter
Pressure unit converter
Specific heat (heat capacity) and entropy unit converter
Temperature unit converter
Thermal conductivity unit converter
Related Topics
-
Air Psychrometrics
Moist and humid air calculations. Psychrometric charts and Mollier diagrams. Air-condition systems temperatures, absolute and relative humidities and moisture content in air. -
Boiling Points of Fluids
Boiling points of elements, products and chemical species at varying conditions. -
Densities
Densities of solids, liquids and gases. Definitions and convertion calculators. -
Fluid Mechanics
The study of fluids - liquids and gases. Involving velocity, pressure, density and temperature as functions of space and time. -
Gases and Compressed Air
Properties of air, LNG, LPG and other common gases. Pipeline capacities and sizing of relief valves. -
Material Properties
Properties of gases, fluids and solids. Densities, specific heats, viscosities and more. -
Viscosities
Viscosities of products and chemical species at varying conditions.
Related Documents
-
Air - Composition and Molecular Weight
Dry air is a mechanical mixture of nitrogen, oxygen, argon and several other gases in minor amounts. -
Air - Density vs. Pressure and Temperature
Air density at pressure ranging 1 to 10 000 bara (14.5 - 145000 psi) and constant selected temperatures. -
Air - Density, Specific Weight and Thermal Expansion Coefficient vs. Temperature and Pressure
Online calculator, figures and tables showing density, specific weight and thermal expansion coefficients of air at temperatures ranging -100 to 1600 °C (-140 to 2900 °F) at atmospheric and higher pressure - Imperial and SI Units. -
Air - Diffusion Coefficients of Gases in Excess of Air
Diffusion coefficients (D12) for gases in large excess of air at temperatures ranging 0 - 400 °C. -
Air - Dynamic and Kinematic Viscosity
Online calculator, figures and tables with dynamic (absolute) and kinematic viscosity for air at temperatures ranging -100 to 1600°C (-150 to 2900°F) and at pressures ranging 1 to 10 000 bara (14.5 - 145000 psia) - SI and Imperial Units. -
Air - Humidity Ratio
The mass of water vapor present in moist air - to the mass of dry air. -
Air - Moisture Holding Capacity vs. Temperature
The moisture holding capacity of air increases with temperature. -
Air - Molecular Weight and Composition
Dry air is a mixture of gases where the average molecular weight (or molar mass) can be calculated by adding the weight of each component. -
Air - Prandtl Number
Prandtl number for air vs. temperature and pressure. -
Air - Specific Heat vs. Pressure at Constant Temperature
Figures and tables with isobaric (Cp) and isochoric (Cv) specific heat of air at constant temperature and pressure ranging 0.01 to 10000 bara. -
Air - Specific Heat vs. Temperature at Constant Pressure
Online calculator with figures and tables showing specific heat (Cp and Cv) of dry air vs. temperature and pressure. SI and imperial units. -
Air - Speed of Sound vs. Temperature
Speed of sound in air at standard atmospheric pressure with temperatures ranging -40 to 1000 °C (-40 to 1500 °F) - Imperial and SI Units. -
Air - Thermal Diffusivity vs. Temperature and Pressure
Figures and tables withdry air thermal diffusivity vs. temperarure and pressure. SI and Imperial units. -
Air - Thermophysical Properties
Thermal properties of air at different temperatures - density, viscosity, critical temperature and pressure, triple point, enthalpi and entropi, thermal conductivity and diffusivity and more. -
Air Conditioning - Cooling of Air and Condensate Generated
Water may condensate when air is cooled in air conditioning systems. -
Ammonia - Properties at Gas-Liquid Equilibrium Conditions
Figures and tables showing how the properties of liquid and gaseous ammonia changes along the boiling/condensation curve (temperature and pressure between triple point and critical point conditions). An ammonia phase diagram are included. -
Compressed Air - Pressure Drop Diagrams, Metric Units
Pressure loss in compressed air pipe lines. -
Dry Air - Thermodynamic and Physical Properties
Thermodynamic properties of dry air - specific heat, ratio of specific heats, dynamic viscosity, thermal conductivity, Prandtl number, density and kinematic viscosity at temperatures ranging 175 - 1900 K. -
Moist Air - Specific Volume
Specific volume of moist air is defined as the total volume of humid air per mass unit of dry air -
Moist Air - Weight of Water Vapor
Weight of water vapor in air -
Solubility of Air in Water
The amount of air that can be dissolved in water decreases with temperature and increases with pressure.

