Indoor Relative Humidity vs. Outdoor Relative Humidity and Temperature
Recommended indoor relative humidity vs. outdoor relative humidity and temperature.
When cold humid outdoor air is supplied and heated in a building - the relative humidity of the air is decreased.
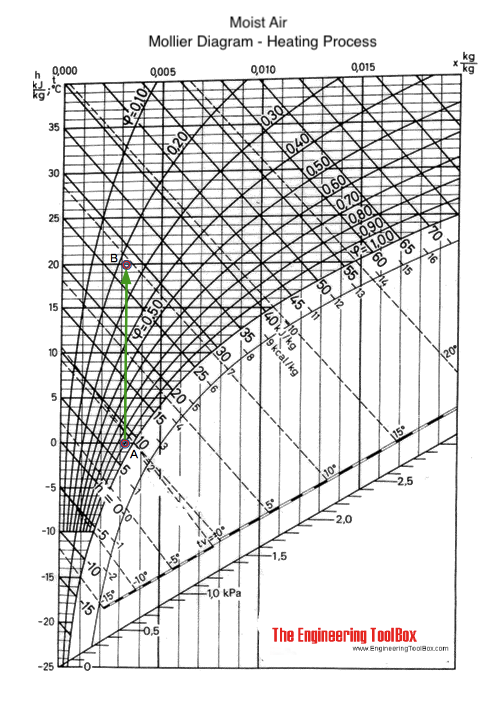
This heating process can be visualized in a psychrometric chart or in a Mollier diagram - as below:

Example - Indoor Relative Humidity of Heated Outdoor Air
Outdoor air with dry bulb temperature 0 oC and relative humidity 90% is heated to an indoor temperature 20 oC.
The process is visualized in the Mollier diagram above with the process from A to B along the constant specific humidity - x - line. From the diagram we can estimate the indoor relative humidity to approximately 23%.
Note! - indoor supplies of vapor to the moist air - like latent heat from humans, animals or production processes - is not counted for. Latent heat supplied to the indoor air will move point B in the diagram to the right - to higher relative humidity. Sensible heat supplied to the room will move point B further up in the diagram.
Example - Indoor Relative Humidities for a given Outdoor Temperature and Relative Humidities
The table below illustrates the change in indoor relative humidity for a given outdoor temperature and relative humidities.
| Outdoor Temperature | Outdoor Relative Humidity (%) | Indoor Temperature | Indoor Relative Humidity (%) |
|---|---|---|---|
| -7 (oC) 20 (oF) |
0 | 21 (oC) 70 (oF) |
0 |
| 20 | 3 | ||
| 40 | 6 | ||
| 60 | 8 | ||
| 80 | 11 |


