Pipes - Insulated Heat Loss Diagrams
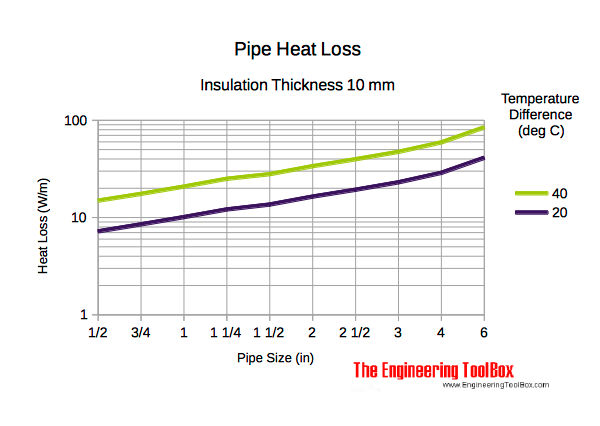
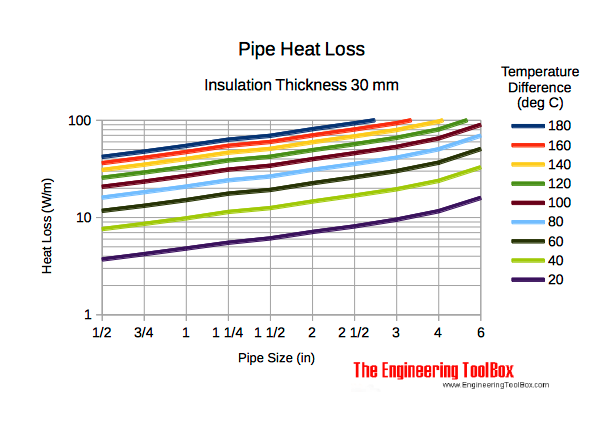
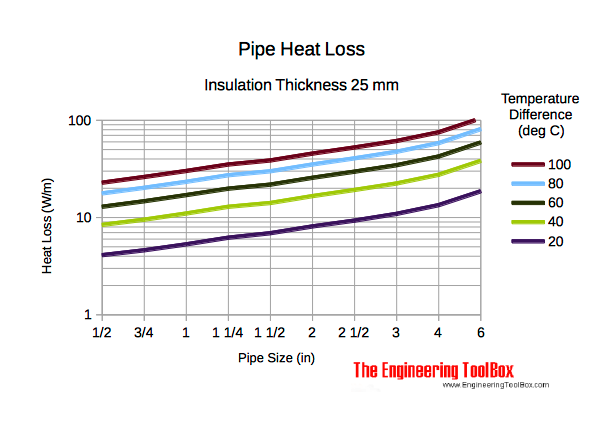
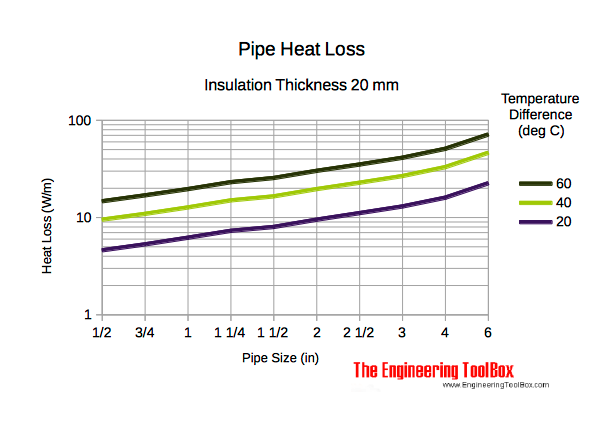
Heat loss (W/m) from 1/2 to 6 inches insulated pipes - ranging insulation thickness 10 to 80 mm and temperature differences 20 to 180 degC.
The heat loss diagrams below can be used to indicate the heat loss from insulated pipes at various temperature differences. The diagrams are based on
- metal pipes
- fiber glass insulation with thermal conductivity 0.036 W/(mK)
- outdoor condition with moderate wind 9 m/s
A safety factor of 10% is included.
- indoor location - reduce values with 10%
- mineral wool insulation - increase values with 6%
- rigid cellular polyurethane - reduce values by 30%
- Heat loss diagram (W/m)
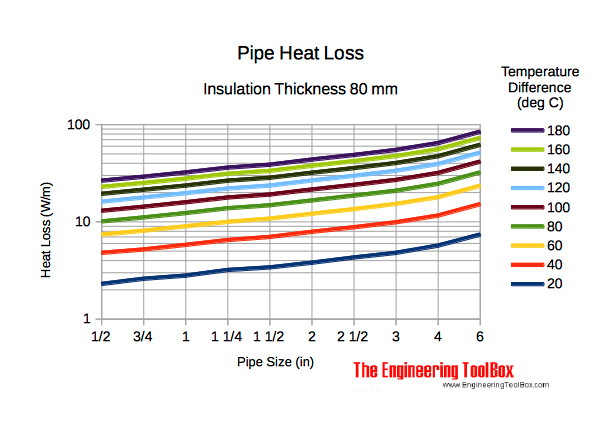
Pipe Heat Loss - Insulation thickness 80 mm
- 1 W/m = 0.305 W/ft
- 1 oC = 1.8 oF
Example - Heat Loss from Insulated Pipe Line
100 m of steel pipe with nominal dimension 2 1/2 inches is insulated with 80 mm fiber glass insulation. The temperature of the fluid in the pipe is 90 oC and the ambient temperature outside the pipe is 10 oC.
From the diagram above - 80 mm fiber glass insulation, temperature difference 80 oC and pipe dimension 2 1/2" - the heat loss is approximately 20 W/m.
The heat loss from the whole pipe can be calculated as
(100 m) (20 W/m)
= 2000 W
Pipe Heat Loss - Insulation thickness 50 mm
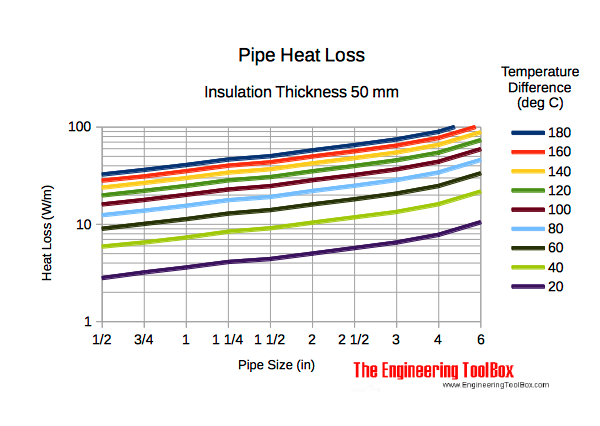
Pipe Heat Loss - Insulation thickness 40 mm
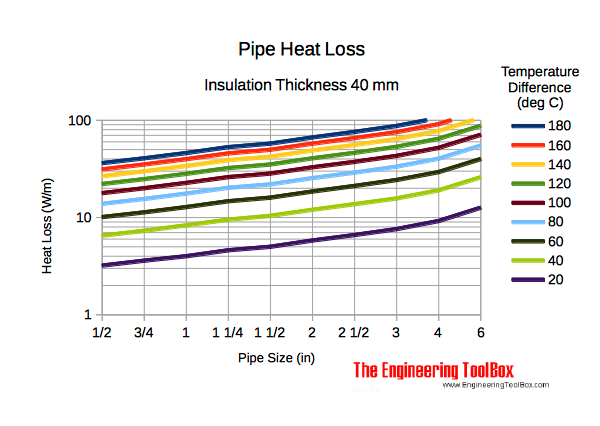
Pipe Heat Loss - Insulation thickness 30 mm
Pipe Heat Loss - Insulation thickness 25 mm
Pipe Heat Loss - Insulation thickness 20 mm
Pipe Heat Loss - Insulation thickness 10 mm
