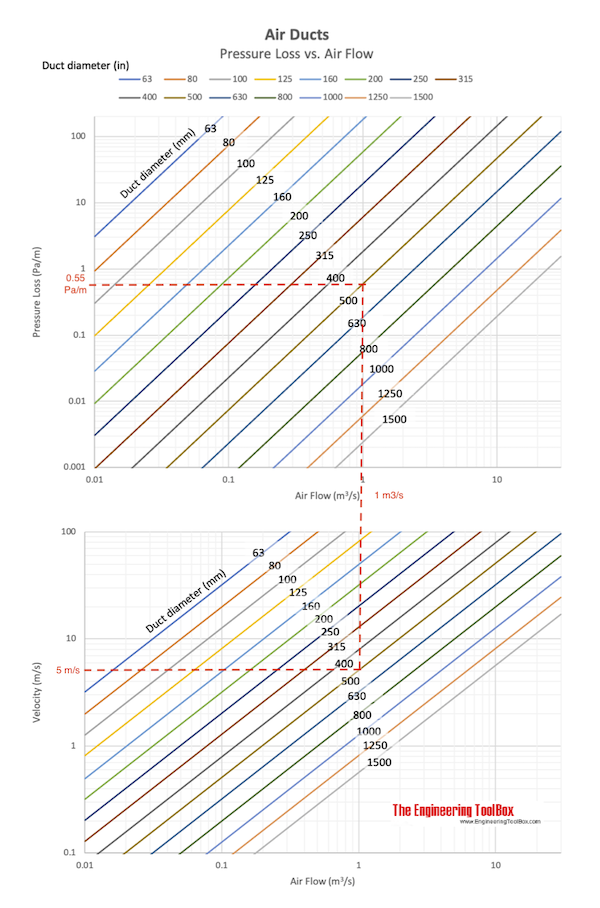
Air Ducts - Friction Loss Diagram
A major friction loss diagram for air ducts - SI units.
Friction loss in standard air ducts:
 Download and print Air Duct Pressure Loss vs. Air Flow and Duct Dimension Chart
- 1 m/s = 196.85 ft/min
- 1 m3/s = 3600 m3/h = 1000 dm3(liter)/s = 35.32 ft3/s = 2118.9 ft3/min = 13200 Imp.gal (UK)/min = 15852 gal (US)/min
- 1 mm H2O = 9.81 Pa = 9.807×10⁻⁶ N/mm2 = 0.0987×10⁻³ bar = 1 kp/m2 = 0.09678×10⁻³ atm = 1.422×10⁻³ psi (lbf/in2)
Example - Air Duct and Friction Loss
As indicated in the diagram above, the friction loss in a 500 mm main duct with air flow 1 m3/s - in a comfort system with air velocity limited to 5 m/s - can be estimated to 0.55 Pa/m (0.055 mm H2O/m).


