Engineering ToolBox - Resources, Tools and Basic Information for Engineering and Design of Technical Applications!

Air Ducts - Major Friction Loss vs. Temperature and Pressure

The influence of temperature and air pressure on major friction loss.

Air ducts friction loss and pressure drop diagrams are normally made for air at Normal Temperature and Pressure (NTP) condition - with a temperature of 20 oC and a atmospheric pressure of 1 bar.

Influence of Temperature

The friction coefficient in the D'Arcy-Weisbach Equation increases with higher temperature but the coefficient will also be outweighed by the reduced pressure loss due to reduced density of the air.

  • the pressure loss in an air duct is reduced with higher temperature

With air temperature other than 20 oC - a "Temperature Compensating Coefficient" can be used to modify the pressure loss:

Δp = kt ΔpNTP         (1)

where

Δp = actual friction loss (pressure or head)

kt = Temperature Compensating Coefficient

ΔpNTP = friction loss at NTP conditions (pressure or head)

"Temperature Compensating Coefficient" for various air temperatures:

air ducts friction loss temperature compensation

air ducts friction loss temperature compensation

Example - Air with Temperature 100oC

For air with temperature 100oC the "Temperature Compensating Coefficient" is approximately 0.83. So,

  • the pressure loss in air with temperature 100oC is approximately 83 % of the pressure loss in air at standard NTP conditions 20 oC

Influence of Pressure

If the actual pressure differ from atmospheric pressure (1 bar abs) - friction loss in air ducts should be compensated with a "Pressure Compensating Coefficient":

Δp = kp ΔpNTP         (2)

where

Δp = actual friction loss (pressure or head)

kp = Pressure Compensating Coefficient

ΔpNTP = friction loss at NTP conditions (pressure or head)

The "Pressure Compensating Coefficient" can be estimated for various pressures from the diagram below:

air ducts friction loss pressure compensation

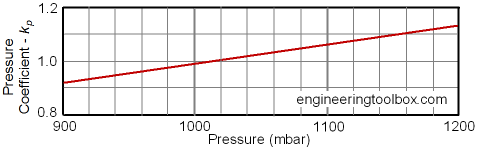
  • 1000 mbar = 1 bar = 105 Pa (N/m2) = 0.1 N/mm2 = 10,197 kp/m2 = 10.20 m H2O = 0.9869 atm = 14.50 psi (lbf/in2) = 106 dyn/cm2 = 750 mmHg

Related Topics

  • Ventilation Systems

    Design of systems for ventilation and air handling - air change rates, ducts and pressure drops, charts and diagrams and more.

Related Documents

Search

Search is the most efficient way to navigate the Engineering ToolBox.

Engineering ToolBox - SketchUp Extension - Online 3D modeling!

3D Engineering ToolBox Extension to SketchUp - add parametric components to your SketchUp model

Add standard and customized parametric components - like flange beams, lumbers, piping, stairs and more - to your Sketchup model with the Engineering ToolBox - SketchUp Extension - enabled for use with older versions of the amazing SketchUp Make and the newer "up to date" SketchUp Pro . Add the Engineering ToolBox extension to your SketchUp Make/Pro from the Extension Warehouse !

Translate this Page

Translate this page to Your Own Language .

About the Engineering ToolBox!

Privacy Policy

We don't collect information from our users. More about

We use a third-party to provide monetization technologies for our site. You can review their privacy and cookie policy here.

You can change your privacy settings by clicking the following button: .

Citation

This page can be cited as

  • The Engineering ToolBox (2006). Air Ducts - Major Friction Loss vs. Temperature and Pressure. [online] Available at: https://www.engineeringtoolbox.com/air-ducts-temperature-pressure-friction-loss-d_1016.html [Accessed Day Month Year].

Modify the access date according your visit.

3D Engineering ToolBox - draw and model technical applications! 2D Engineering ToolBox - create and share online diagram drawing templates! Engineering ToolBox Apps - mobile online and offline engineering applications!

Unit Converter


3.27.8

.