Acid and Base pH Indicators
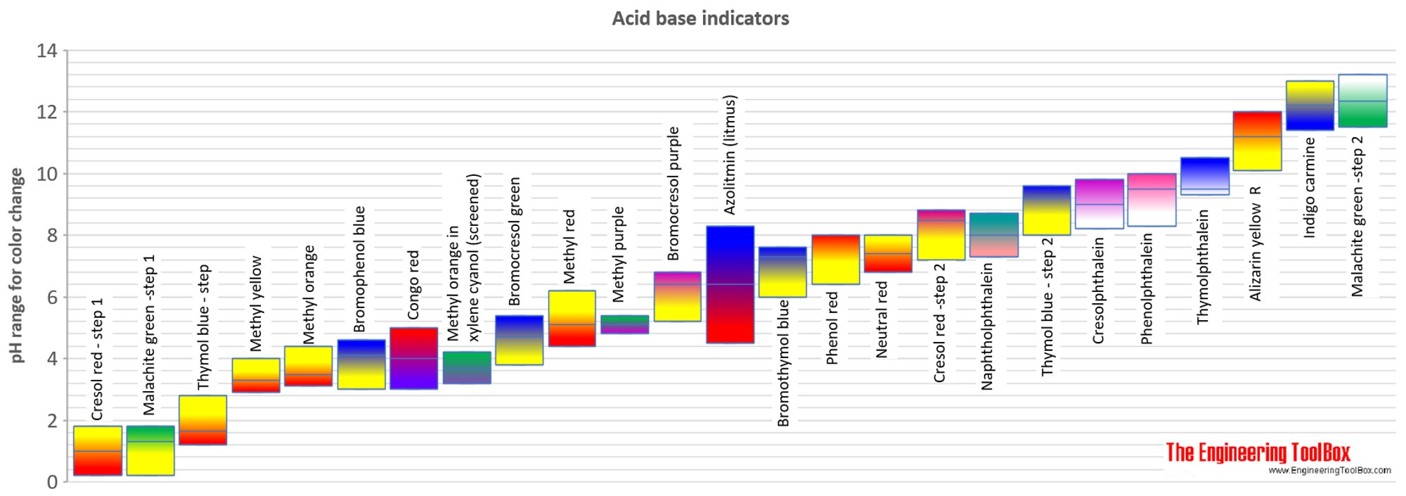
pH range vs. color change for acid and base indicators - together with pKa and structures of the indicators.
The ranges for the color changes are given in the table below the figure, together with the corresponding pKa value of the indicators.
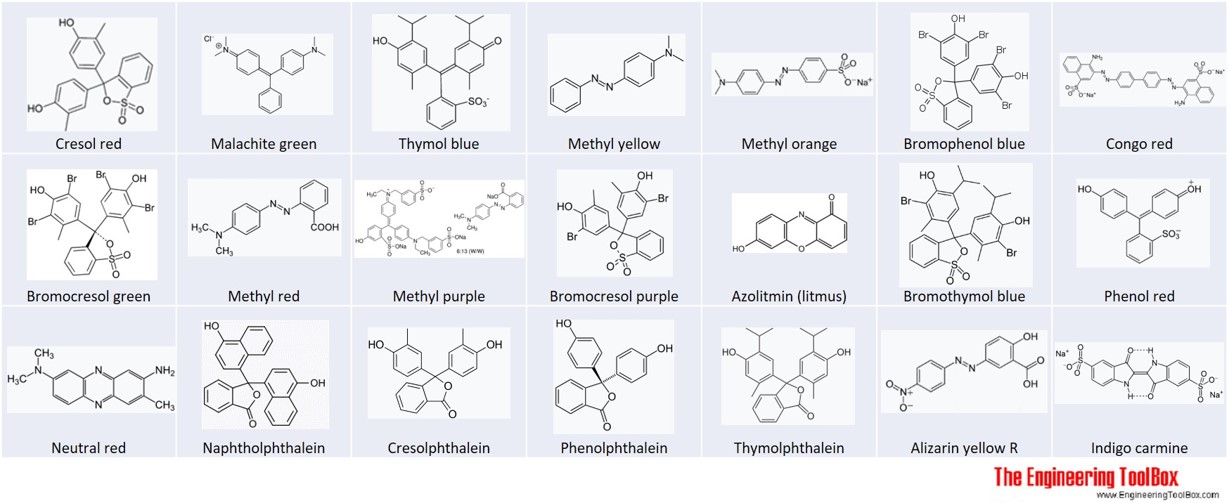
The molecule structure of each indicator is shown below the table.
See also pKa values of inorganic acids and bases, organic nitrogen compound and alcohols and carboxylic acids.
| Trade name | pH start | pH end | pKa | low pH color | high pH color |
|---|---|---|---|---|---|
| Cresol red - step 1 | 0.2 | 1.8 | 1.0 | red | yellow |
| Malachite green -step 1 | 0.2 | 1.8 | 1.3 | yellow | green |
| Thymol blue - step 1 | 1.2 | 2.8 | 1.7 | red | yellow |
| Methyl yellow | 2.9 | 4.0 | 3.3 | red | yellow |
| Methyl orange | 3.1 | 4.4 | 3.5 | red | yellow |
| Bromophenol blue | 3.0 | 4.6 | 4.1 | yellow | blue |
| Congo red | 3.0 | 5.0 | blue-violet | red | |
| Methyl orange in xylene cyanol (screened) | 3.2 | 4.2 | grey-violet | green | |
| Bromocresol green | 3.8 | 5.4 | 4.7 | yellow | blue |
| Methyl red | 4.4 | 6.2 | 5.1 | red | yellow |
| Methyl purple | 4.8 | 5.4 | purple | green | |
| Bromocresol purple | 5.2 | 6.8 | 6.4 | yellow | purple |
| Azolitmin (litmus) | 4.5 | 8.3 | red | blue | |
| Bromothymol blue | 6.0 | 7.6 | 7.3 | yellow | blue |
| Phenol red | 6.4 | 8.0 | 8.0 | yellow | red |
| Neutral red | 6.8 | 8.0 | red | yellow | |
| Cresol red -step 2 | 7.2 | 8.8 | 8.5 | yellow | reddish-purple |
| Naphtholphthalein | 7.3 | 8.7 | pale red | greenish-blue | |
| Thymol blue - step 2 | 8.0 | 9.6 | 9.2 | yellow | blue |
| Cresolphthalein | 8.2 | 9.8 | colorless | purple | |
| Phenolphthalein | 8.3 | 10.0 | 9.5 | colorless | red-pink |
| Thymolphthalein | 9.0 | 10.5 | 9.2 | colorless | blue |
| Alizarin yellow R | 10.1 | 12.0 | 11.2 | yellow | red |
| Indigo carmine | 11.4 | 13.0 | blue | yellow | |
| Malachite green -step 2 | 11.5 | 13.2 | green | colorless |


