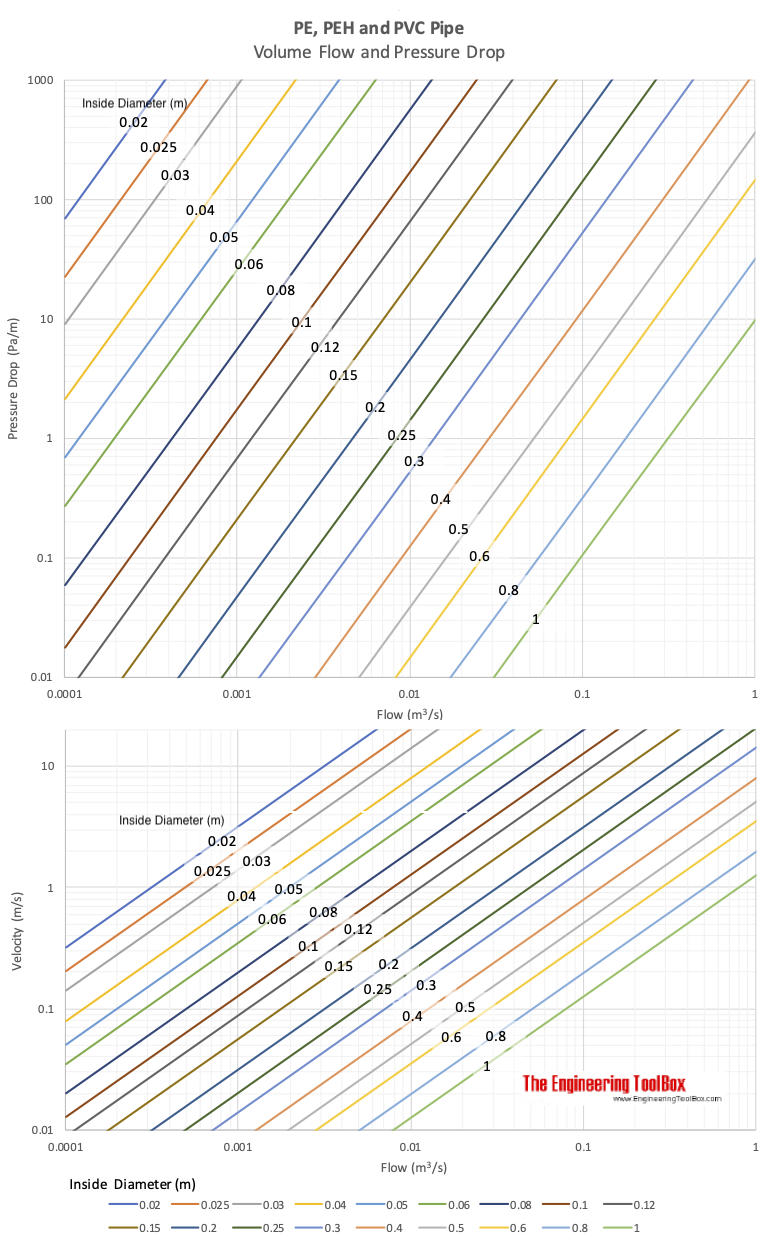
PE, PEH and PVC Pipes - Pressure Loss vs. Water Flow Diagram
Pressure loss (bar/100 m) and velocy in PE, PEH or PVC pipes with water flow.
Pressure drop in PE, PEH or PVC plastic pipes or tubes:

- Download the PE, PEH and PVC pressure drop diagram as pdf file
- Polyethylene (PE) SDR Pressure Rated Tube - Dimensions
- 1 Pa = 10-6 N/mm2 = 10-5 bar = 0.1020 kp/m2 = 1.020×10⁻⁴ m H2O at 4°C/39°F = 9.869×10⁻⁶ atm = 0.004 in H2O= 1.450×10⁻⁴ psi (lbf/in2) = 0.02089 lbf/ft2 (psf)
- 1 m3/s = 3600 m3/h = 1000 l/s = 35.32 ft3/s = 2118.9 ft3/min = 13198 gal(UK)/min = 15850 gal(US liq)/min = 791891 gal(UK)/h = 908.08 qt(US dry)/s
- 1 m = 3.28083 ft = 39.3701 in
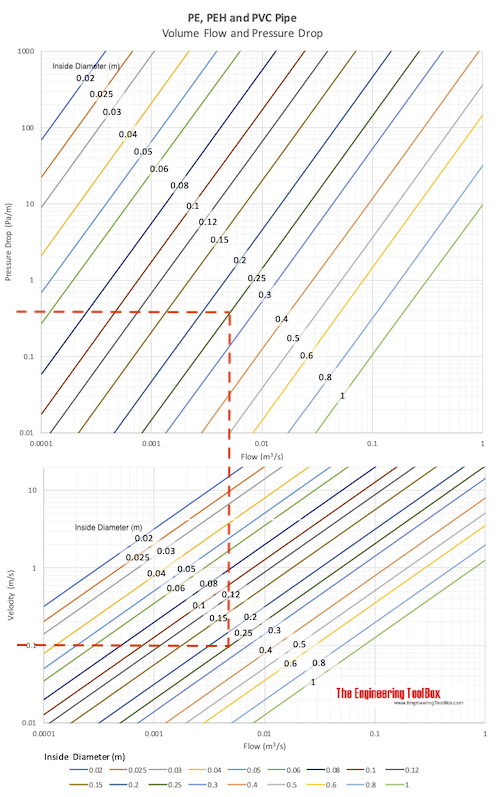
Example - pressure drop in a PEH pipe
Pressure drop in a PEH pipe with inside diameter 250 mm (0.25 m) and water flow 50 l/s (0.005 m3/s) can be estimated to be approximately 0.35 Pa/m (0.035 bar/100 m) as indicated in the diagram below. The flow velocity is approximately 1 m/s.


