Cash Flow Diagrams
The future value of money.
Cash Flow Diagram - Loan Transaction
A loan transaction starts with a positive cash flow when the loan is received - and continuous with negative cash flows for the pay offs.
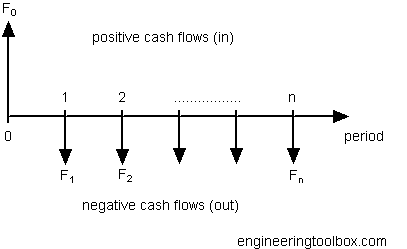
- upward arrows - positive cash flow (receiving the loan)
- downward arrows - negative cash flow (pay off)
The Present Value of the cash flows can be calculated by multiplying each cash flow with a Discount Rate.
Cash Flow Diagram - Investment Transaction
An investment transaction starts with a negative cash flow when the investment is done - and continuous with positive cash flows when receiving the pay backs.
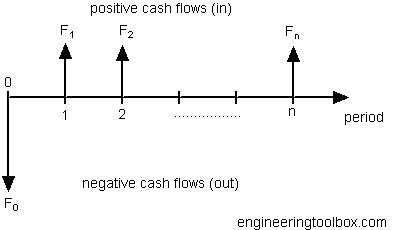
- upward arrows - positive cash flows (pay back)
- downward arrows - negative cash flow (investing)
Related Topics
-
Economics
Engineering economics - cash flow diagrams, present value, discount rates, internal rates of return - IRR, income taxes, inflation.
Related Documents
-
Bid Work Flow Template
A bid work flow template - Online with Google Docs. -
Compound Interest Tables
Compound interest tables - interests rates 0.25 - 60%. -
Contract Types
Commonly used engineering and construction contracts. -
Discrete Compounding Cash Flow Formulas
Discrete payments compounding equations and online calculators . -
Interest Formulas
Future value of single cash flow. -
Interest Rate
Interest rate is the cost of money. -
Internal Rate of Return - IRR
Internal Rate of Return (IRR) - the break-even interest rate. -
Net Present Worth (NPW) of a Cash Stream
The value of a stream of payments is called the Net Present Worth (NPW). -
Present Value
The value of money in the future is the Present Value. -
Uniformat
The ASTM E1557 UNIFORMAT II Standard. -
Value Engineering
Improved value by enhanced function.