Moist Air - Psychrometric Terms
Dry and wet bulb temperature, specific volume, relative humidity, enthalpy and more.
Psychrometry is the science of studying thermodynamic properties of moist air and the use of these to analyze humid air conditions and processes.
Air conditioning processes can be determined with psychrometric charts and Mollier diagrams. Common properties in the charts includes
- dry-bulb temperature
- wet-bulb temperature
- relative humidity (RH)
- humidity ratio
- specific volume
- dew point temperature
- enthalpy
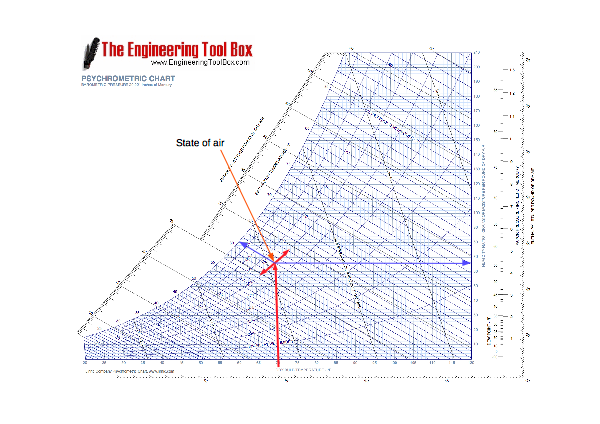
With at least two known properties it is possible to characterize the air in the intersection of the property lines - the state-point. With the intersection point located on the chart or diagram other properties can be read directly.
Example - Psychrometric Chart
Dry-Bulb Temperature - Tdb
Dry-Bulb Temperature, usually referred to as the air temperature, is the air property that is most commonly used. People referring to air temperature normally referring to Dry Bulb Temperature.
Dry-Bulb Temperature - Tdb - can be measured by using a normal thermometer. With Dry-Bulb Temperature the sensible heat content in the air can be determined along the bottom axis of the psychrometric chart. The vertical lines extending upward from this axis are constant-temperature lines.
Wet-Bulb Temperature - Twb
Wet-Bulb Temperature is associated with the moisture content of the air.
Wet Bulb Temperature can be measured with a thermometer that has the bulb covered with a water-moistened bandage with air flowing over the thermometer.
Wet-Bulb Temperatures are always lower than dry bulb temperatures with less than 100% relative humidity in the air. The Wet-Bulb Temperature and the Dry-Bulb Temperature will be identical with 100% relative humidity in the air (the air is at the saturation line).
On the chart, the Wet-Bulb Temperature lines slopes a little upward to the left, and the temperature is read at the saturation line.
Relative Humidity - RH
Relative Humidity is the ratio of the mass of water vapor contents in the humid air - mw - to the maximum possible mass of vapor - mwmax - at the actual pressure and temperature. Relative humidity can also be expressed as the ratio of water vapor pressure - pw, to the water vapor pressure of saturated air at the same temperature - pws.
Relative humidity is expressed as a percentage.
The moisture-holding capacity of air increases with air temperature. In practice the relative humidity will indicate the moisture level of the air compared to the maximum moisture-holding capacity of air at saturation.
Note ! The moisture holding capacity of air increases dramatically with temperature! - important for drying processes.
The relative humidity lines in the psychrometric chart are curved lines that move upwards to the right. The line representing saturated air where the relative humidity - RH is 100% - is the uppermost curved line in the chart.
Dew Point Temperature - Tdp
Dew Point is the temperature at which water vapor starts to condense in the air - the temperature at which air becomes completely saturated. Above this temperature the moisture stays in the air.
The Dew Point Temperature can be read in the psychrometric charts by following the horizontal line from the state-point to the saturation line. The Dew Point Temperature is represented along the 100% relative humidity line.
Specific Volume of Humid Air - v
Specific Volume represents the space occupied by a unit weight of dry air (ft3/lb, m3/kg). Specific volume is indicated along the bottom axis of the psychrometric chart with the constant-volume lines slanting upward to the left.
Moisture Content and Humidity Ratio - x
Moisture Content and Humidity Ratio is the amount of water vapor by weight in dry air.
The moisture content of air is expressed as the weight of water vapor per unit weight of dry air (lbH2O/lbair, kgH2O/kgair).
Humidity ratio is indicated along the right-hand axis in psychrometric charts.
Enthalpy - h
Enthalpy is the measure of the total thermal energy in air.
Energy content is expressed as energy per unit weight of air (Btu/lbair, J/kgair).
Enthalpy in the psychrometric chart can read from where the appropriate wet-bulb line crosses the diagonal scale above the saturation curve.
Air with the same amount of energy may either be drier hotter air (higher sensible heat) or cooler moister air (higher latent heat).


