Reliability of Machine Components
Mean Time Between Failure - MTB and reliability of machine components and systems.
Reliability characterizes components or system of components by the probability they will perform the desired functions for a given time.
In general -
- more components and/or more complicated systems reduces reliability
- simpler systems with few components increases reliability
Reliability equations:
Reliability
Reliability at a given time:
R = e-λt (1)
where
R = reliability. Values between 0 - 1 where value 1 indicates 100% live components and value 0 indicates 0% live components.
λ = proportional failure rate - a failure rate expressed as a proportion of initial number of live components - No - at time t
t = time (hours) - Note! other units can be used as long as the use is consistent through the calculations.
The failure rate at time t can be expressed as
λ = NF / (No t)
= (No - Ns) / (No t) (2)
where
NF = No - Ns = number of failing components at time t
Ns = number of live surviving components at time t
No = initial number of live components at time zero
Example - Failure Rate and Reliability
A car manufacturer sells 400000 cars of a certain model in one year. During the the first tree years the owners of 50000 of these cars experience major failures. The failure rate can be calculated as
λ = (50000 cars) / ((400000 cars) (3 years))
= 0.042 (per year)
The reliability of a model of this car within three years can be calculated as
R = e-(0.042 1/year) (3 year)
= 0.88
= 88 %
Unreliability - the Probability for a Device to Fail
The connection between reliability and unreliability:
R + Q = 1 (3)
where
Q = unreliability. Values between 0 - 1 where value 1 indicates 0% live components and value 0 indicates 100% live components.
(1) and (2) can be used to express unreliability
Q = 1 - e-λt (4)
Example - Unreliability
The unreliability of the car model in the example above within three years can be calculated as
Q = 1 - e-(0.042 1/year) (3 year)
= 0.12
= 12 %
Number of Live Components
The number of live surviving components in a system at a given time:
Ns = No e-λt (5)
Number of Failure Components
The number of failure dead components in a system at a given time:
Ns = No (1 - e-λt) (6)
Mean Time Between Failures - MTBF
Mean time between failures - MTBF:
MTBF = 1 / λ (7)
where
MTBF = Mean Time Between Failure (hours)
- MTTF - Mean Time To Failure is an alternative to MTBF

Example - Mean Time Between Failure
From the example above the failure rate is 0.042 per year. MTBF can be calculated as
MTBF = 1 / (0.042 1/year)
= 23.8 years
Mean Time Between Failure (MTBF) can be determined by rating Total Surviving Hours against Number of Failures as
MTBF = ts / NF (8)
where
ts = total surviving hours (hours)
Combining (5) with the formulas for reliability and more
R = e-t/m (1b)
Q = 1 - e-t/m (4b)
Ns = No e-t/m (5b)
Nf = No (1 - e-t/m) (6b)
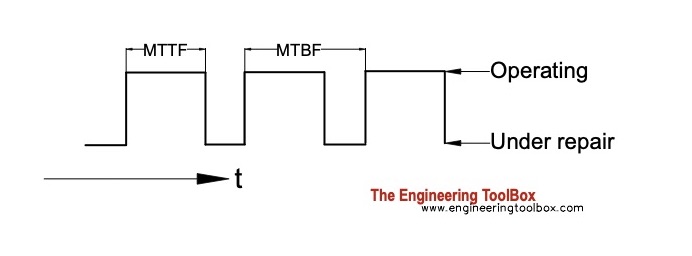
MTBF vs. MTTF vs. MTTR
- MTBF - Mean Time Between Failures > commonly used to determine average time between failures
- MTTF - Mean Time To Failure > commonly used for replaceable products that cannot be repaired
- MTTR - Mean Time To Repair > commonly used to determine how long it will take to get a failed product running again
MTBF and MTTF are often used interchangeably.
Systems Reliability
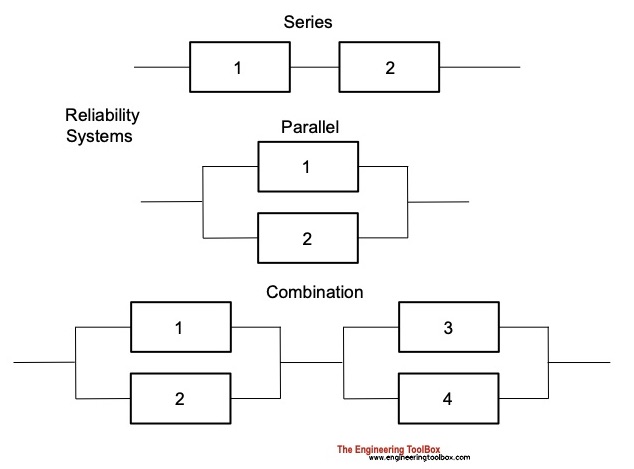
There are two basic types of reliability systems - series and parallel - and combinations of them.
- in a series system - all devices in the system must work for the system to work
- in a parallel system - the system works if at least one device in the system works

Reliability of Systems in Series
Reliability of systems in series can be expressed as
Rs = R1 R2 (9)
where
Rs = system reliability
R1,2 = subsystem reliability
Example - Reliability of Systems in Series
From the example above the reliability of a car over three year is 0.88. If we depends on two cars for a mission - whatever it is - the reliability for our mission will be
Rs = (0.88) (0.88)
= 0.77
= 77 %
Reliability of Systems in Parallel
Reliability of systems in parallel can be expressed as
Rs = R1 Q2 + R2 Q1 + R1 R2 (10)
where
Q1,2 = (1 - R1,2) subsystem unreliability
Example - Reliability of Systems in Parallel
From the example above the reliability of a car over three year is 0.88. If it is enough with one of our two cars for our mission - the reliability for our mission can be calculated as
Rs = (0.88) (1- 0.88) + (0.88) (1- 0.88) + (0.88) (0.88)
= 0.99
= 99 %
Note! - two systems in parallel with 99 % reliability vs. one system alone with reliability 88 % shows the power of redundancy.


