Water Control Valves - Flow Factor Kv Diagram
Sizing of water control valves - SI units
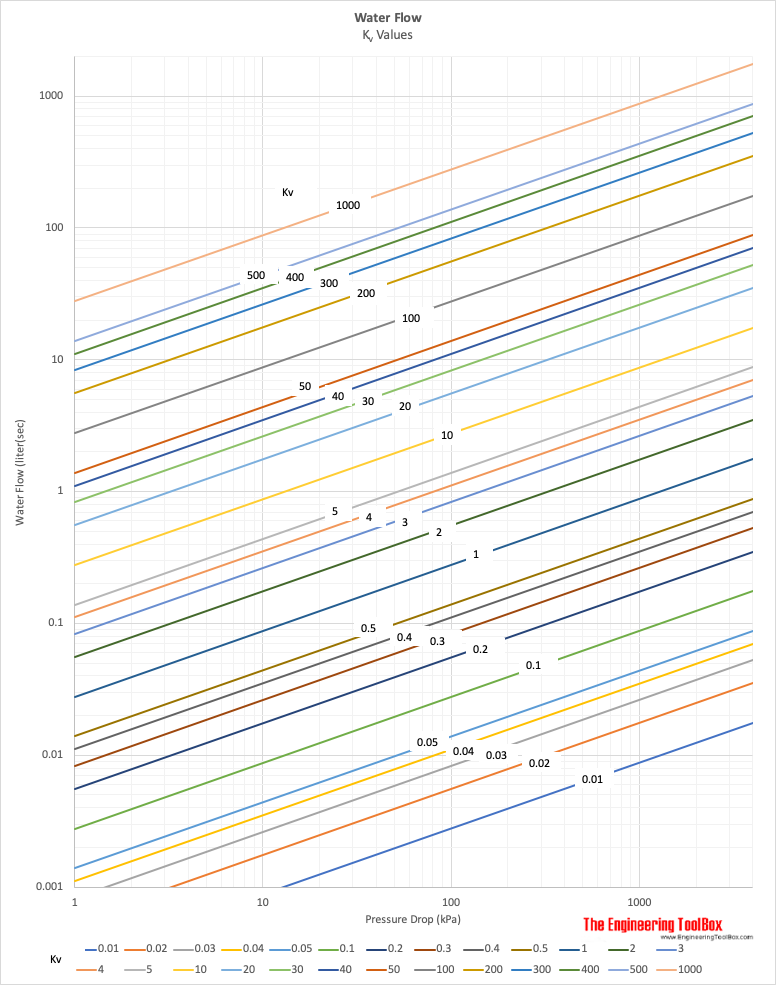
The flow factor Kv for control valves in water systems can be estimated from the diagram below:

- 1 bar = 1×10⁵ Pa (N/m2)
Example - a Water Valve and Kv value
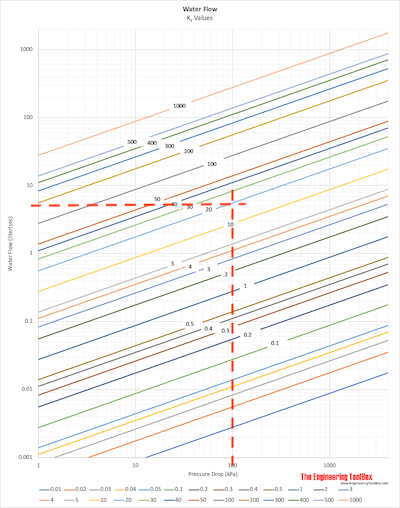
The maximum pressure drop through a modulating control valve in a water flow system is designed to be 100 kPa. The flow through the valve is 5 liter/s. The required kv value for the valve can be estimated as indicated in the diagram below to approximately 20.

Note - larger valves (with larger Kv) reduces the maximum pressure modulating spans - limiting the ability to provide a stable process control. As a consequence - control valves are often one to two dimensions below the dimensions of the connecting pipes.
Example - with a water flow of 5 liter/s the pipe size would be in the range 3 - 4 inches (80 - 100 mm nominal). A control valve would be in the size kv ~ 20 - or in the range 2 - 3 inches (50 - 80 mm nominal).


